Executions Page
This document provides basic information on executions and executions page and how to filter executions based on flow names, flow statuses and the time interval.
Executions
An execution is the path of an initial message through a flow. As the message gets into the flow (generated by a scheduler, received by a webhook, etc.), the platform assigns an execution ID to it. This ID follows the message through the entire flow, forming an execution. Also, the same ID will be assigned to any messages caused by this initial message in the flow. The following diagram demonstrates executions using a webhook flow:
A client sent two messages to a webhook URL simultaneously. The message A passed by the webhook trigger to the next action without change. While processing the message the action produced 10 more messages which passed to the following action. In summary we can say that an external stimulus produced an execution A with 11 messages in the platform. Similarly another external stimulus produced the execution B with 11 messages. These two executions are separated logically but not necessarily physically.
As for a polling flow, everything works as shown on the diagram:
The platform internal scheduling triggers a polling flow execution. The message emitted by the trigger creates a large number of messages that all belong to the same execution. In the example above 101 messages belong to the same execution as they were caused by the same trigger message. A new execution is created in the next scheduling interval.
The action receiving the data processes it in parallel or serially, and emits 10 messages for each piece of data. The last action of the flow receives 100 messages totally. All the 110 messages belong to the same execution. In the following sections, we will describe how to manage executions on the platform.
Executions Page
Navigate to the new executions page from the left-side menu, under the Analyze selection. Select the new Executions menu item to navigate to this new page.
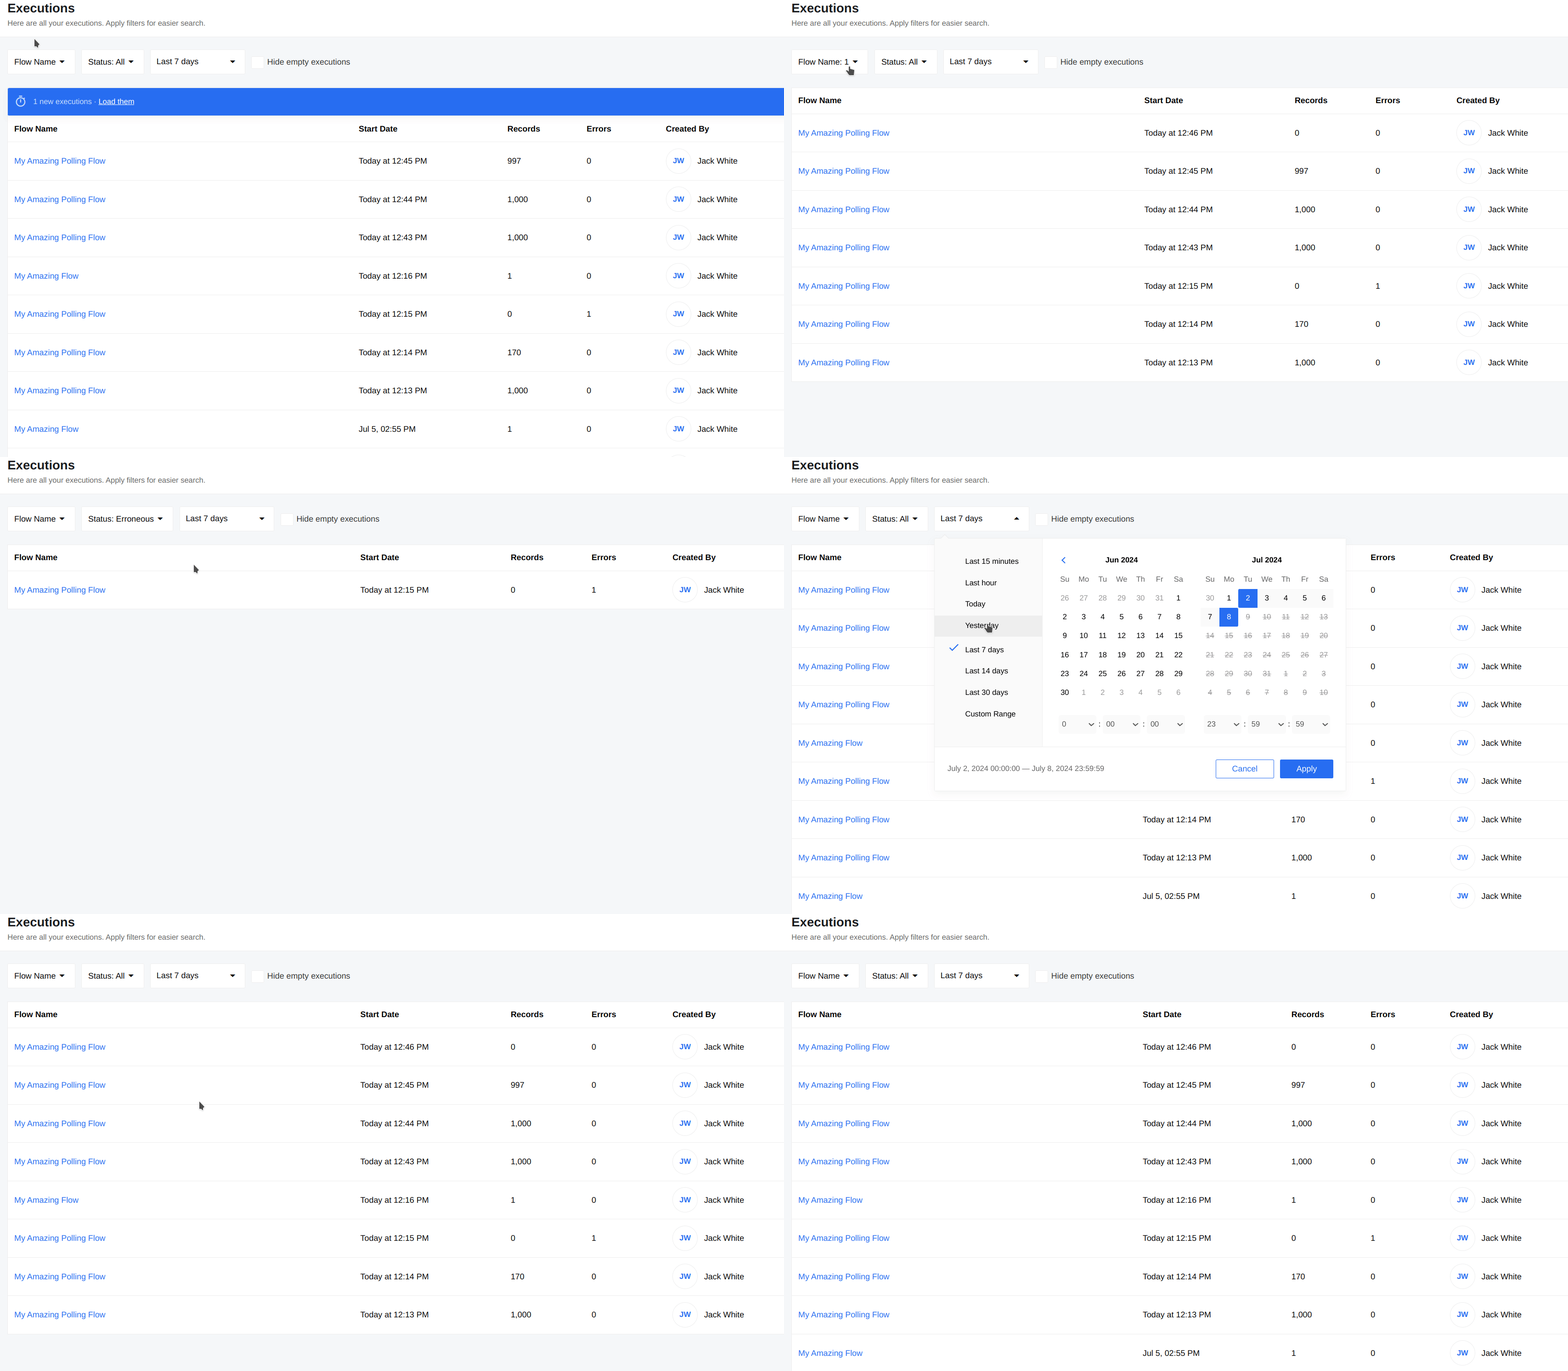
This page shows the list of all executions. You can filter the executions by flow names, flow statuses, time interval and excluding the empty resutls.
The platform adds all filters to the URL code, so you can send a link to the filtered executions list to your colleague.
https://address-to-your-platform/c/5b62c919fd98ea00112d53ad#/w/57977bd3be64438036000003/executions?flow_ids=5dd0838225f7b3b4e8280b5c&time_from=2020-01-06T21%3A54%3A00.000Z&time_to=2020-01-06T22%3A54%3A59.999Z&thread_type=successful
If new executions happened while you are browsing the list of executions, the platform
will show a notification at the top of the list, and a prompt to load them. You can dismiss
it by clicking X. The idea is to not let new executions interfere with
your current selection. The screenshot below shows a typical view with a notification:
When you dismiss the notification above the new executions are not lost, you will get the same notification with an updated number of new executions again when new executions happen.
A Technical Note - to benefit from this page, all your custom components must use the latest Nodejs Sailor (above 2.5.4). Restart all the real-time flows after updating your components.
Filtering by flow name
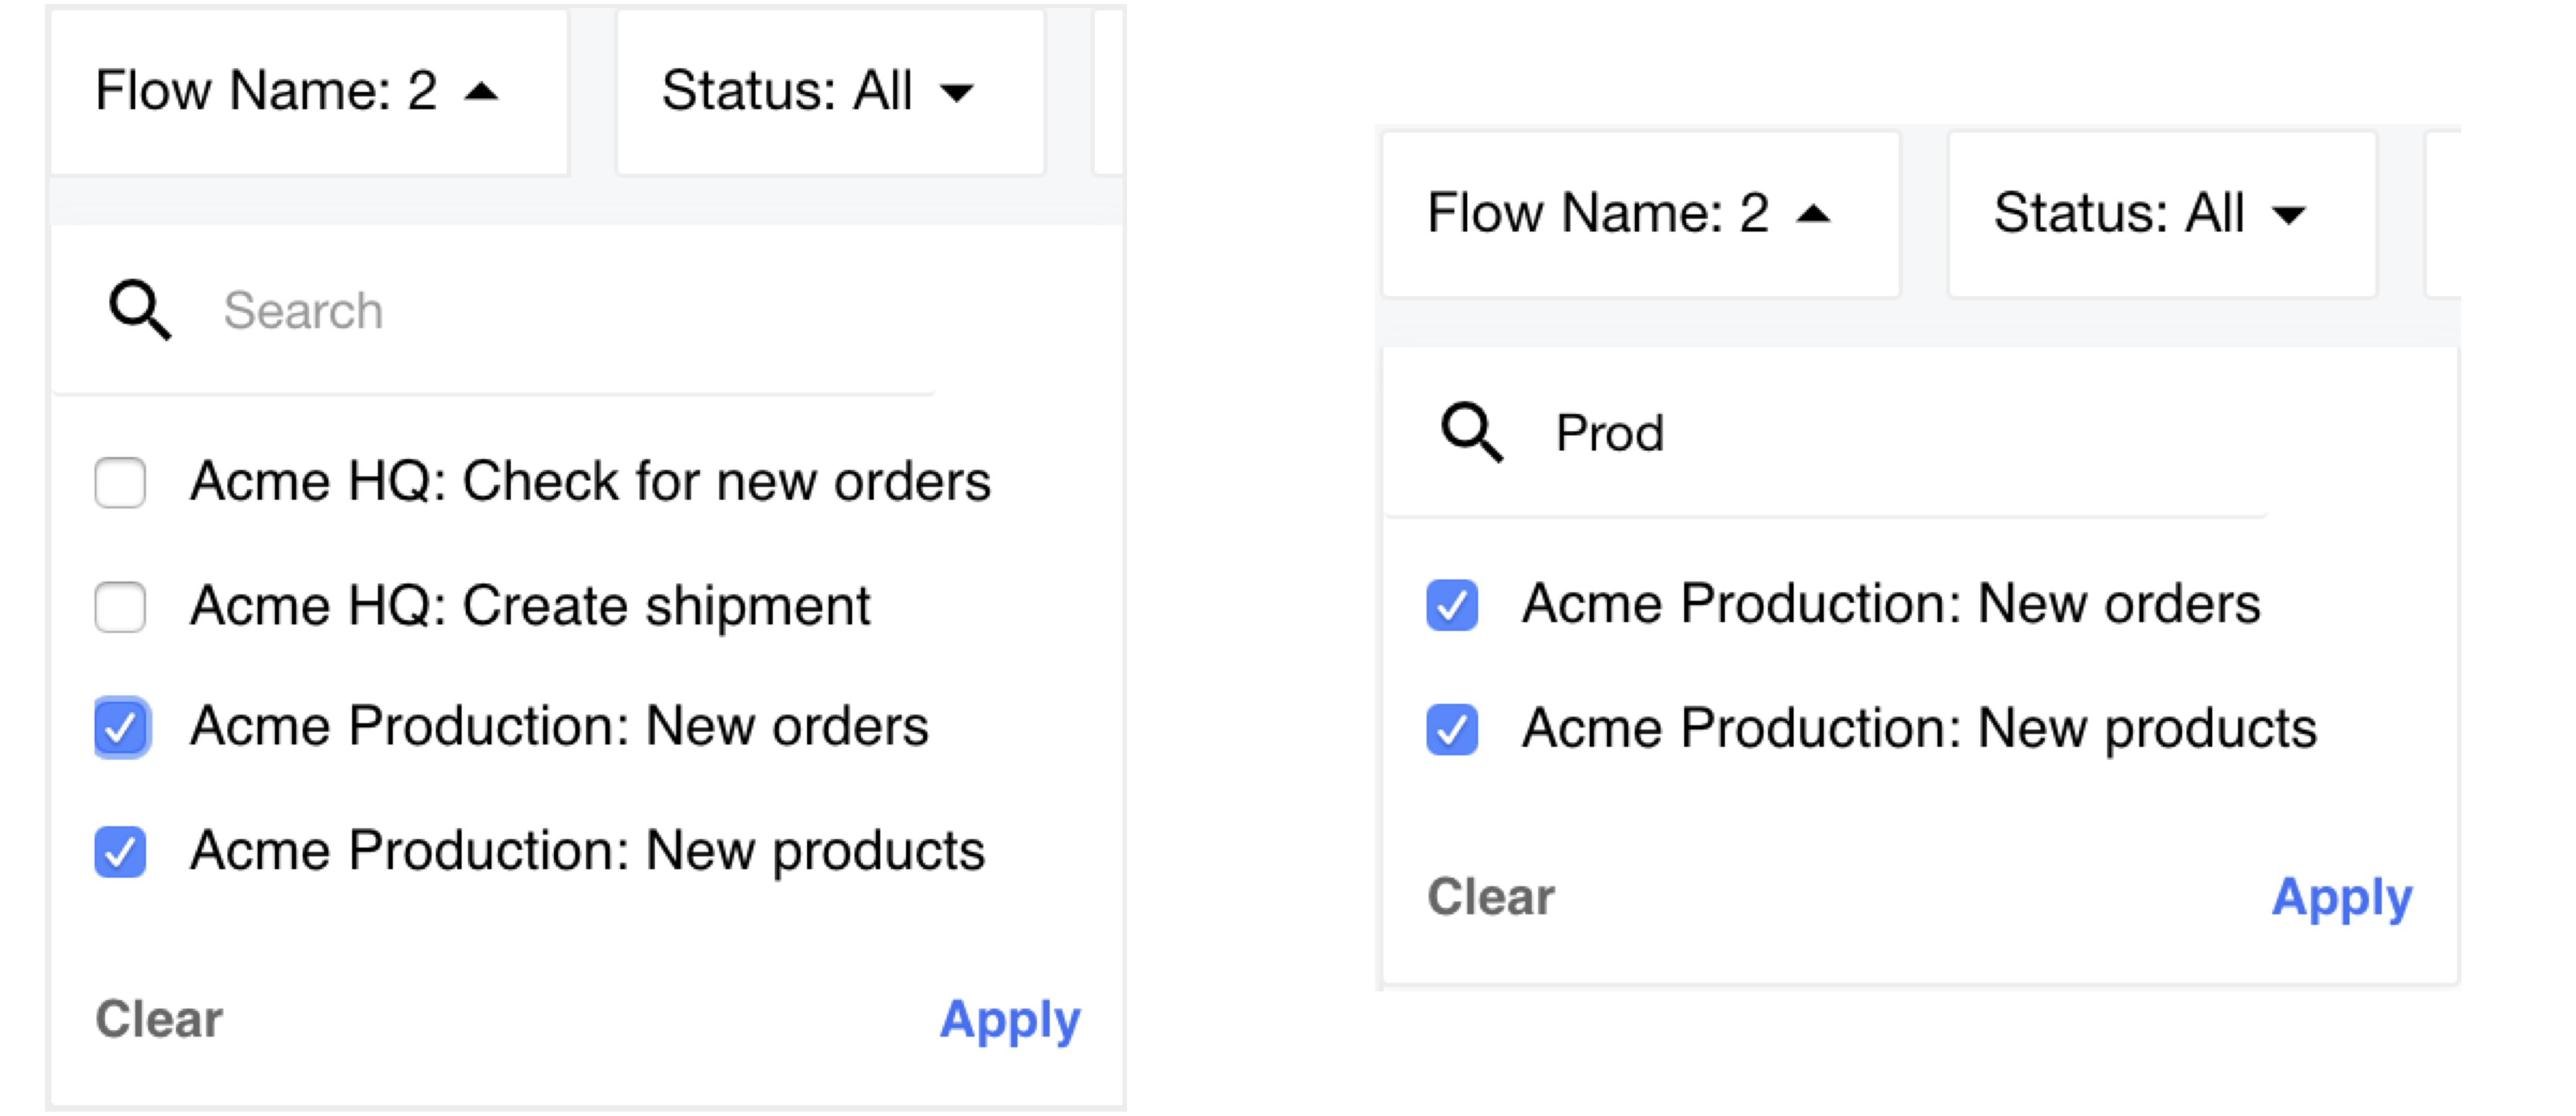
This filter allows you to concentrate on executions of one or more flows by selecting the check-boxes in front of their names in the drop-down menu.
You can select more than one flow if you need to debug related flows. Here you can search for the flow names to find the relevant flows faster.
Note, by deselecting all (or pressing Clear) you will return to the default view of all executions from all the active flows.
Filtering by Status
This filter allows you to list executions based on their statuses: Successful or Erroneous. By default the platform shows all executions.
Filtering by time interval
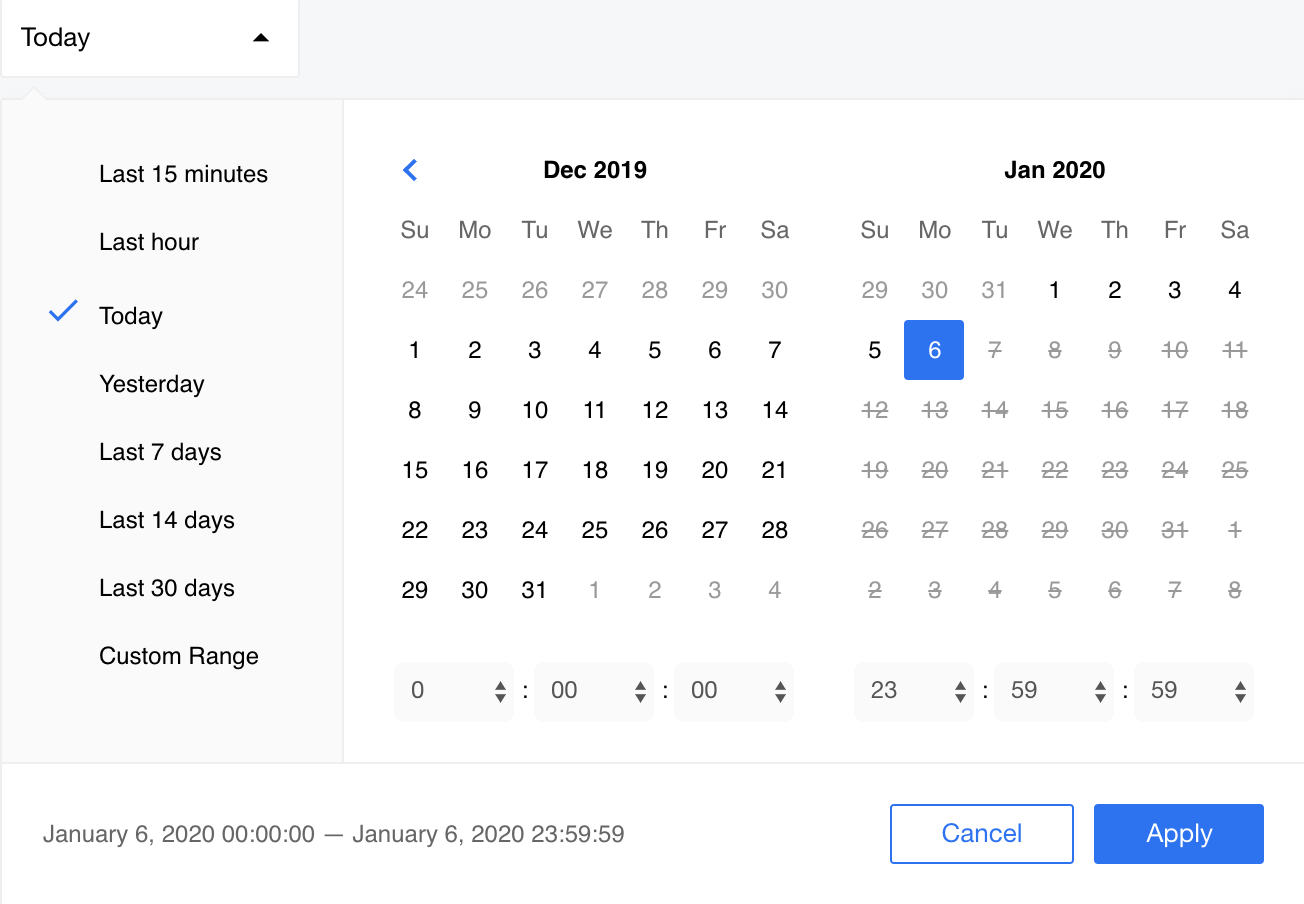
This filter allows you to list executions based on their time. A drop-down menu offers a calendar view where you can customise and concentrate on the time interval when the executions have started.
Picture above shows the default view of the time interval with today’s executions.
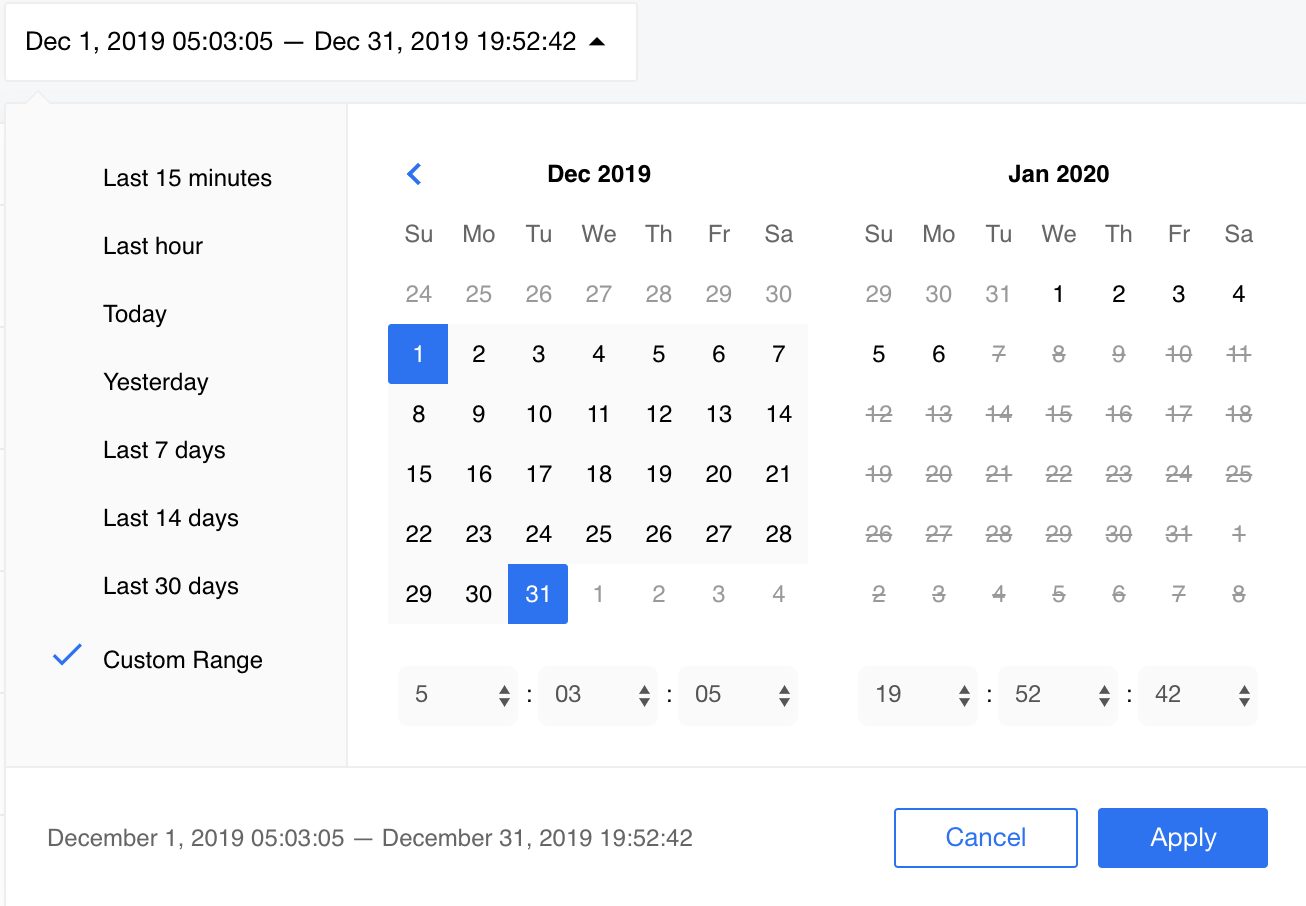
You can select any of the predefined options like last 15 minutes, last hour,
today, etc. Or you can customise it further using the calendar view by selecting
the starting date and end date. You can also select the starting and ending hour
of the interval.
Please Note: you must press Apply for it to take effect. You will know it worked when the check-mark shows the Custom Range and the name interval menu shows the selected interval instead of Today.
Hide Empty Results
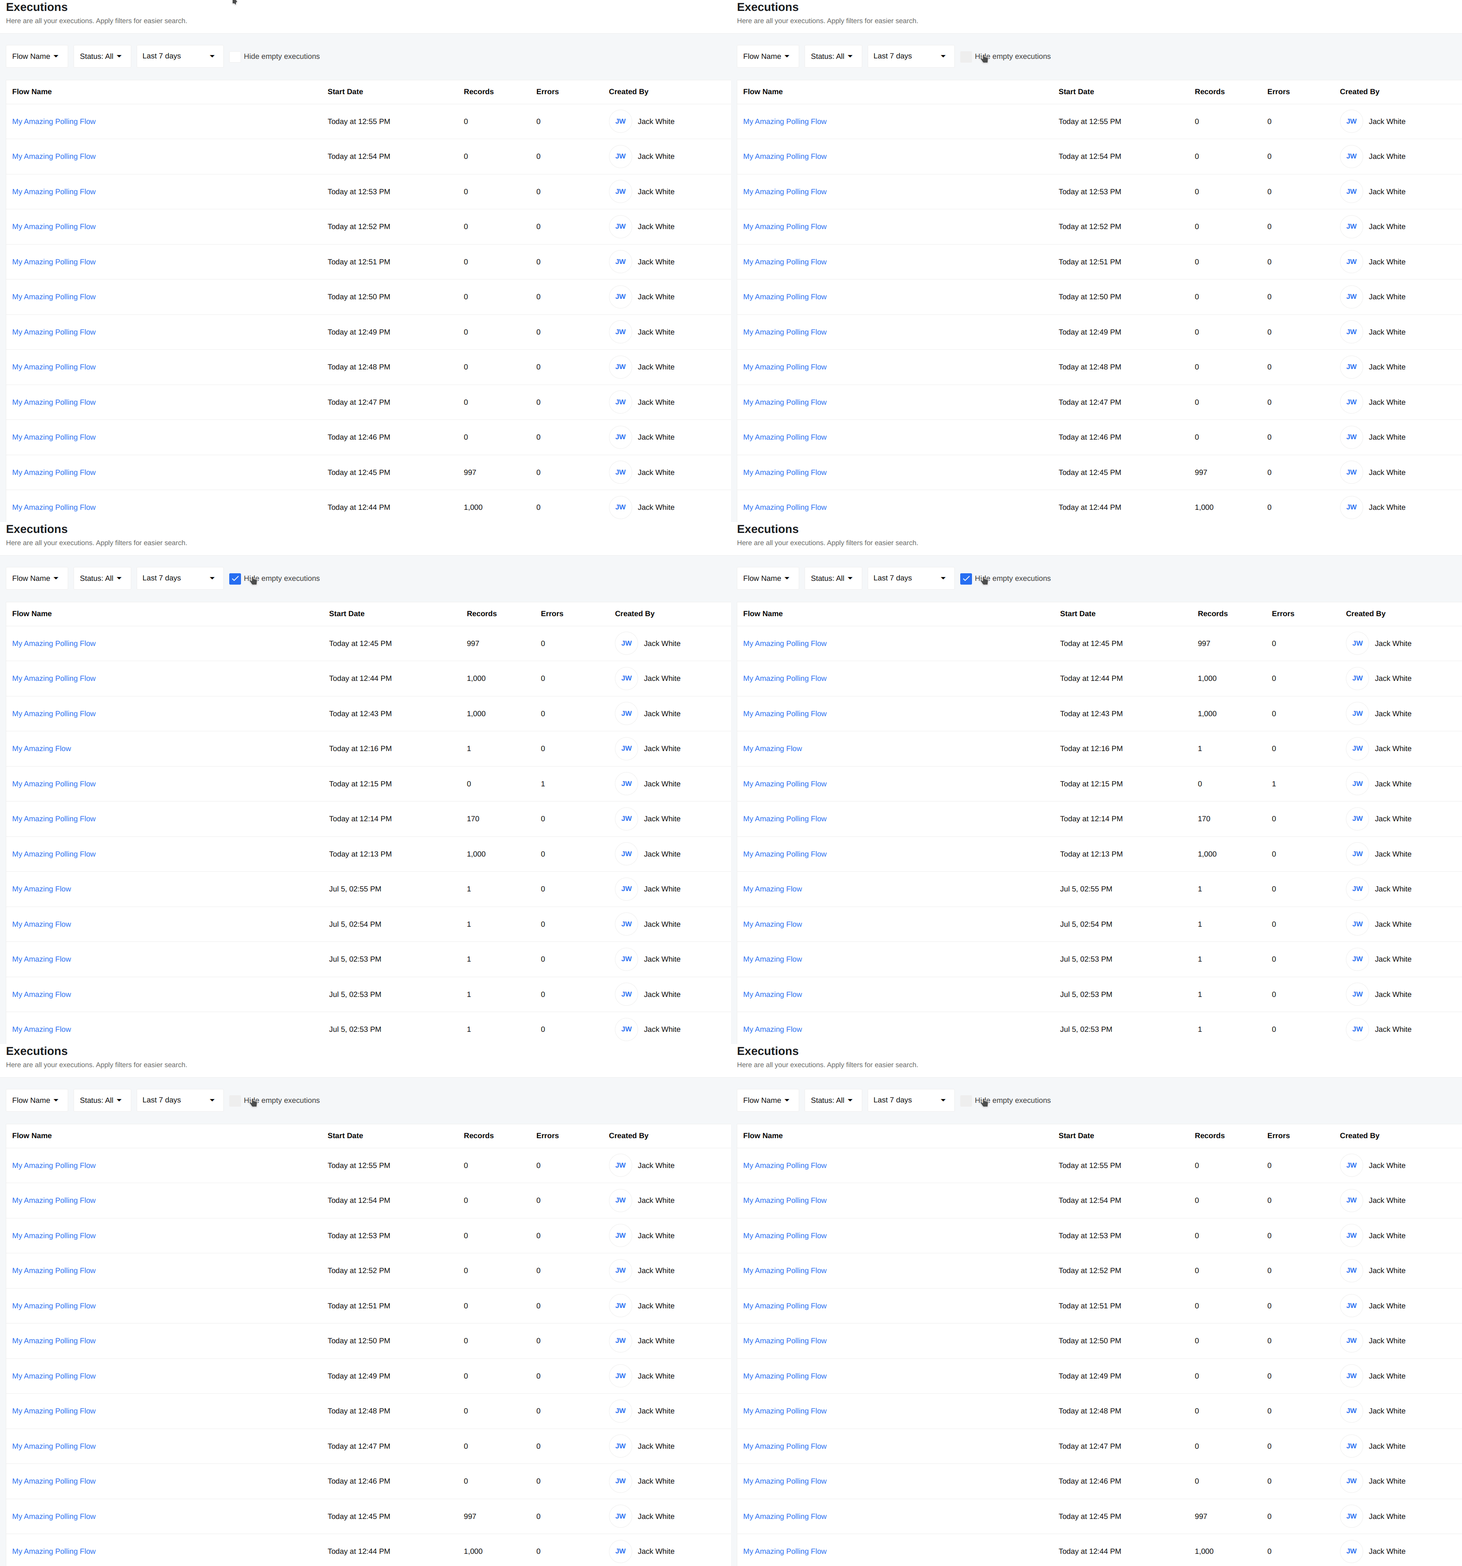
When flow is running in Polling Trigger mode, Executions that do not find new data often occur. This results in many empty entries on the Executions page, which can make it difficult to navigate and search for the desired executions. The “Hide Empty Results” checkbox hides executions without messages and simplifies navigation.
Debugging the executions
Since most of the errors inside components are related to the processed data, executions are beneficial for debugging integration flows. On the executions page you can select a single execution:
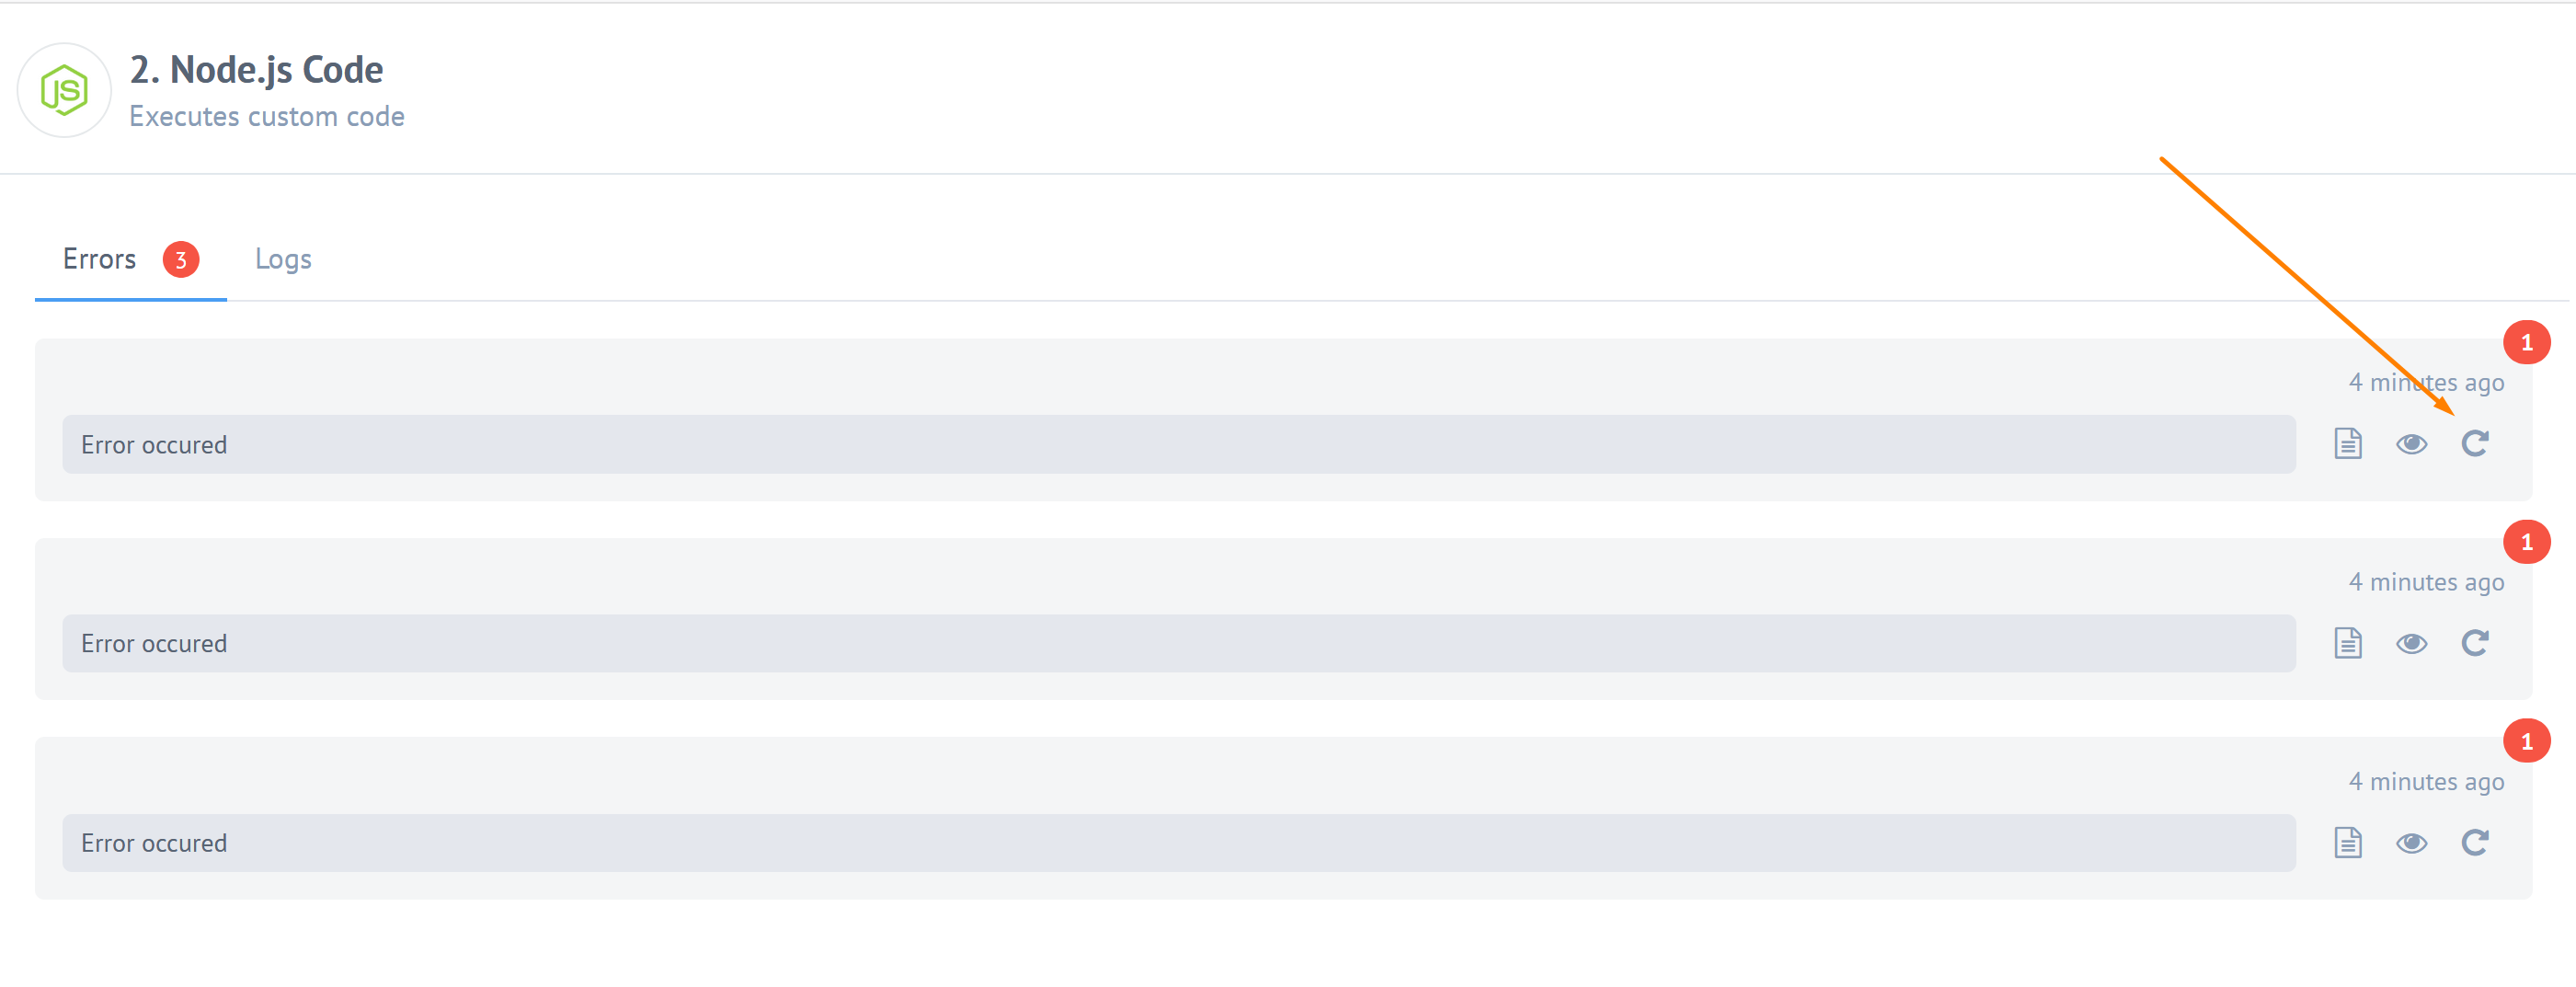
Then, for example, you can check the errors that occurred:
You can use the retry feature to re-submit or retry.


