Managing Flow Errors
This document describes the way to find errors that occur in your Flows, and deal with them.
Flow Errors
Let’s start with the fact, that no errors on the Platform are fatal. There is never a reason to panic - everything has a solution. Maybe you won’t even need any assistance with it. All the errors are gathered in one convenient list that you can access from the Dashboard. To see the list of errors, navigate to the Dashboard and click Errors tab:
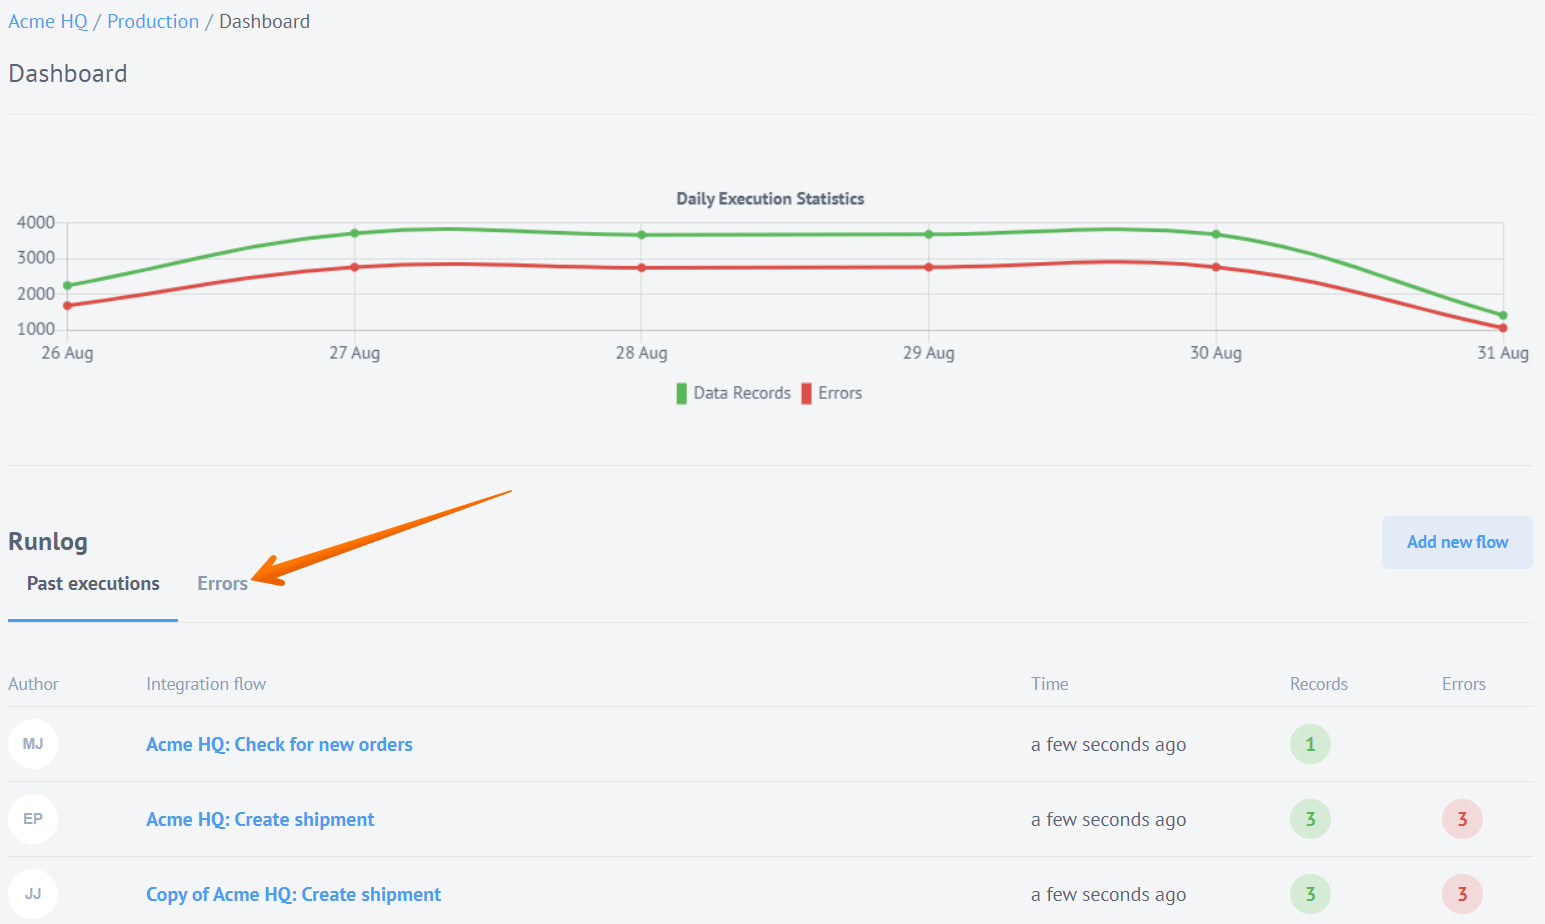
This list allows you to address any error by Error type, Flow, Flow author, and time of occurrence. Let’s take the first one we see in our list and check it:

As you can see, the error type hints us to go look for answers in the logs. Many other errors give you some sort of a hint, for example a number that refers to a specific problem. To access Component logs from the Error list, click Flow name to open the required Flow:

In the Flow, open the Component that causes the error. In our case it failed to start:
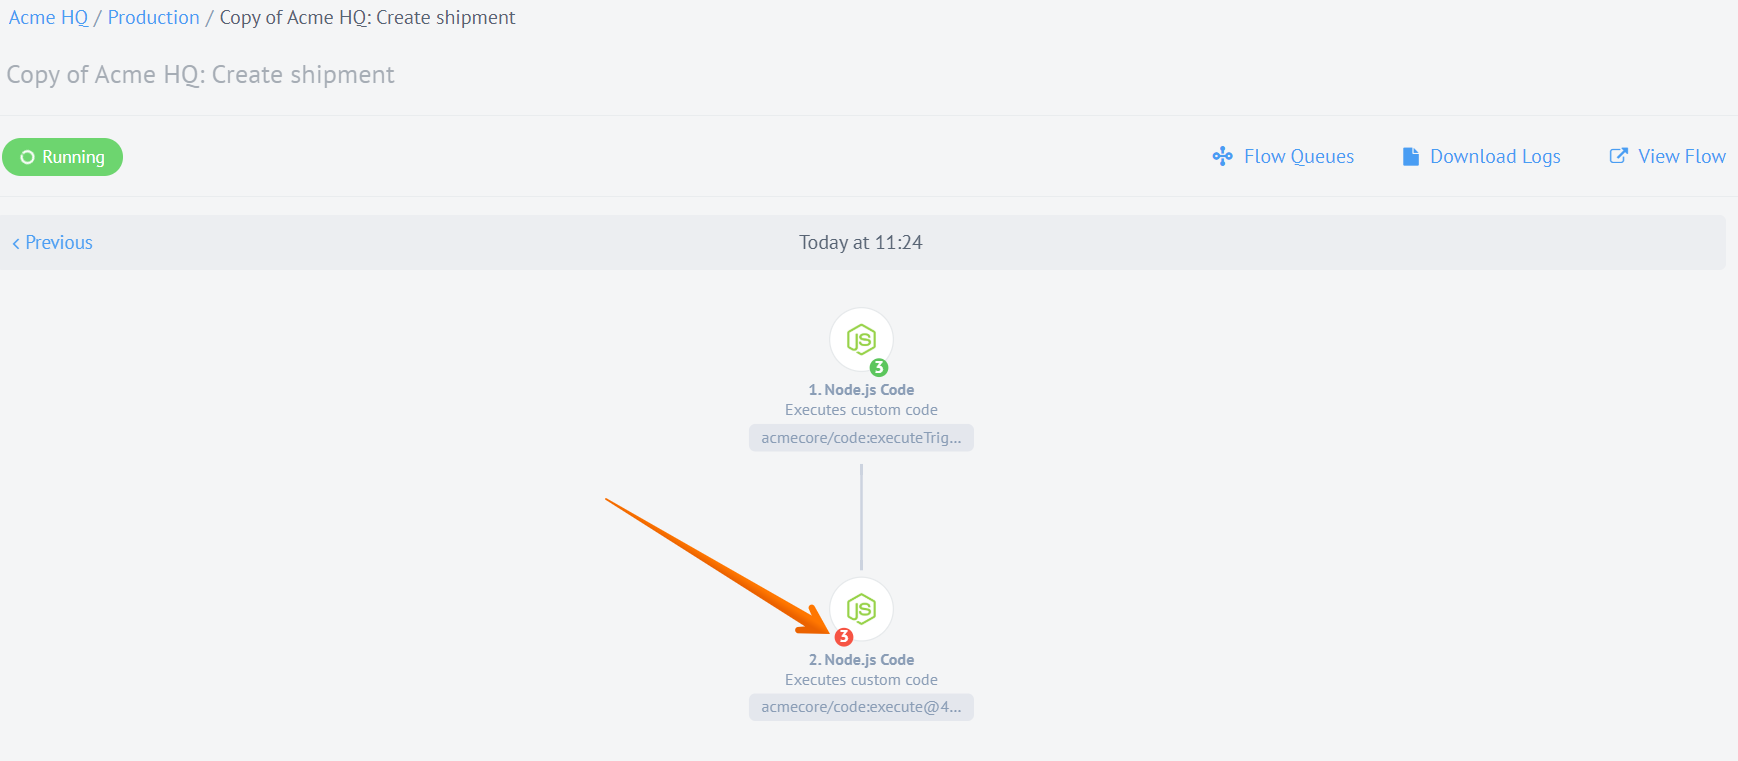
Now open the Logs tab:
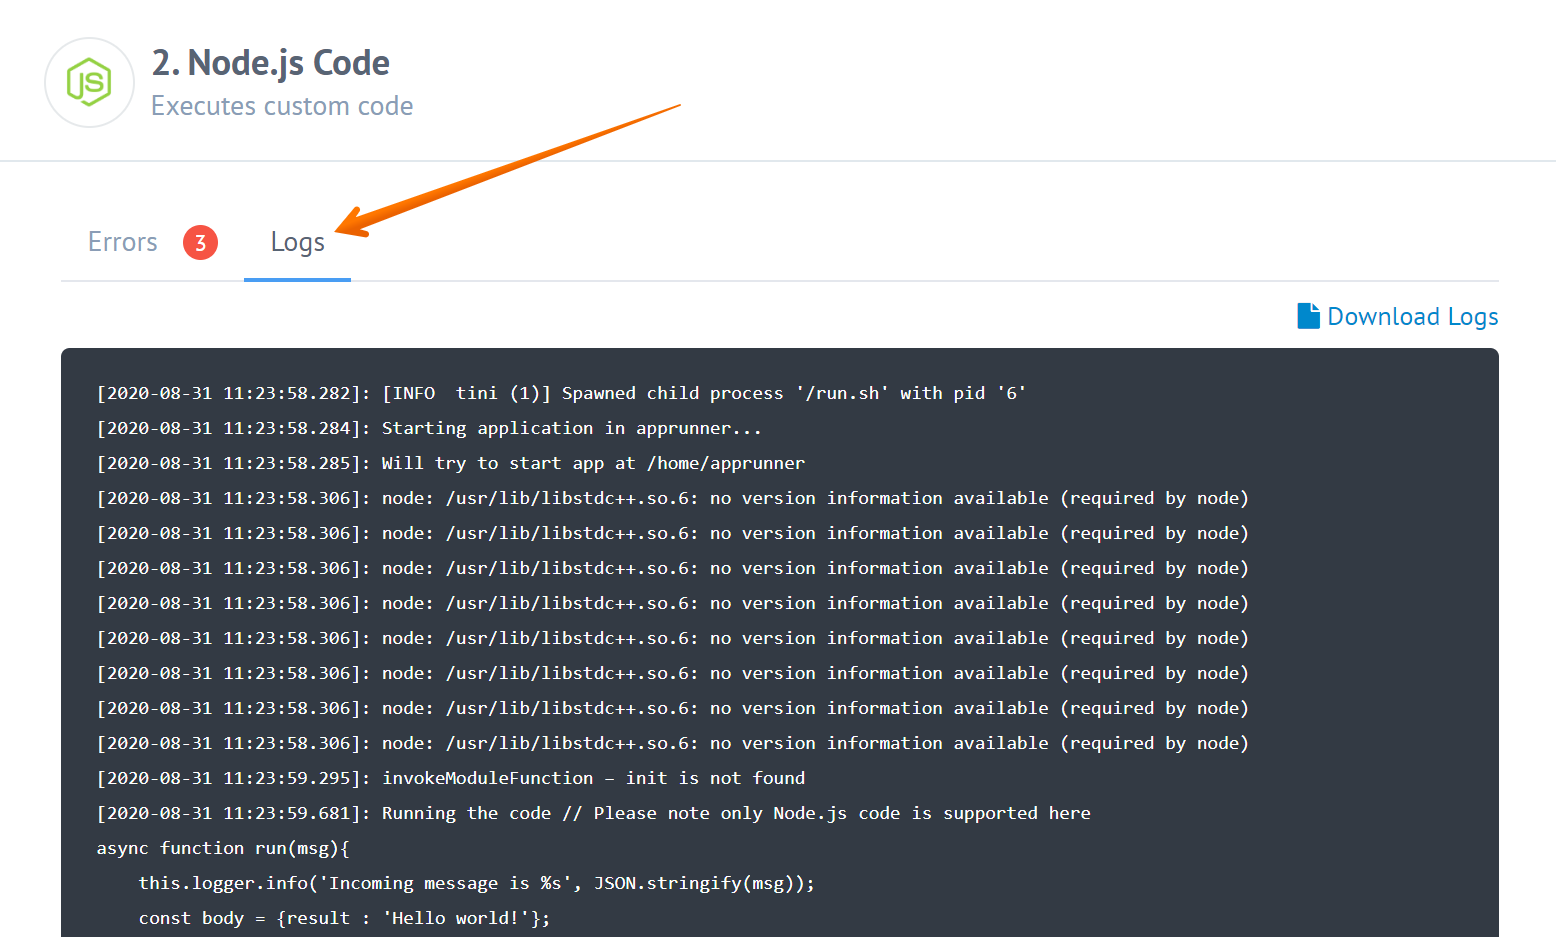
By analyzing the logs, you can, most likely, find the cause of the error, and come up with a solution. Also, you apply to our Support for assistance.
Downloading the Logs
Logs of a particular component or integration flow may contain some important information that is useful when investigating issues. With the Download Logs feature, an integration administrator or integration developer can download complete logs of a single connector or even a whole flow. This allows to analyze them without having to page through them via elastic.io UI.
You can also download logs by clicking the corresponding button for:
Integration Flow Logs
You can download logs of the one execution for whole integration flow as shown below:
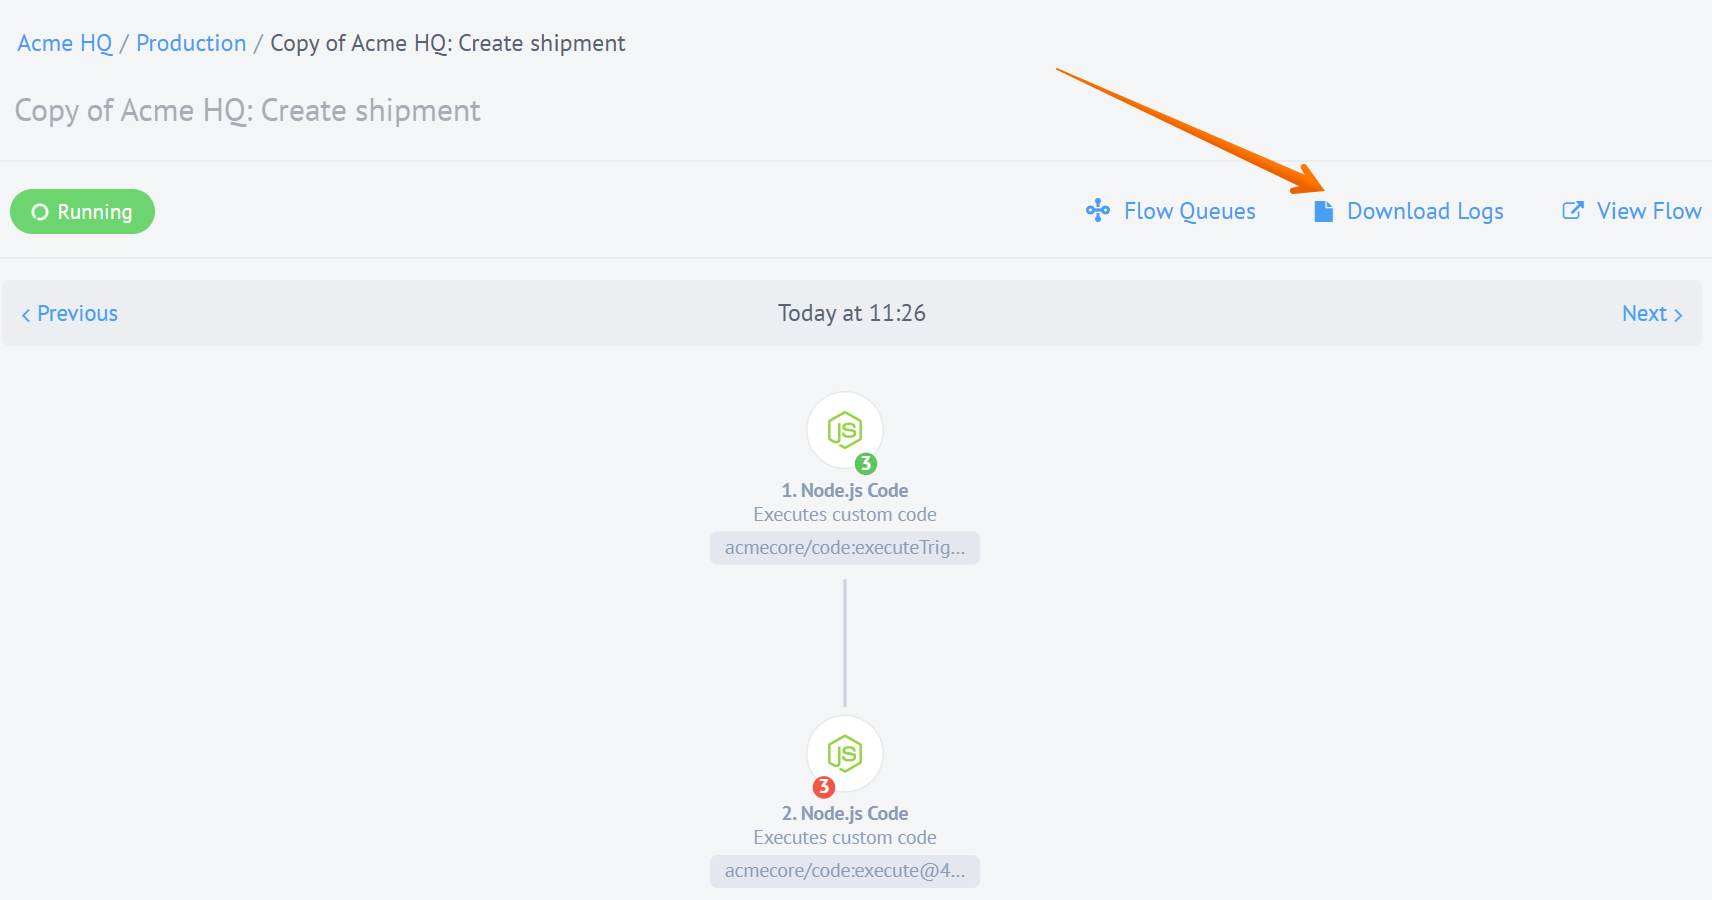
The downloaded logs are in .log format and contain logs of all steps in one
execution sorted according to the time-stamp.
Integration Step Logs
You can download logs of the one step during the same execution the following way:
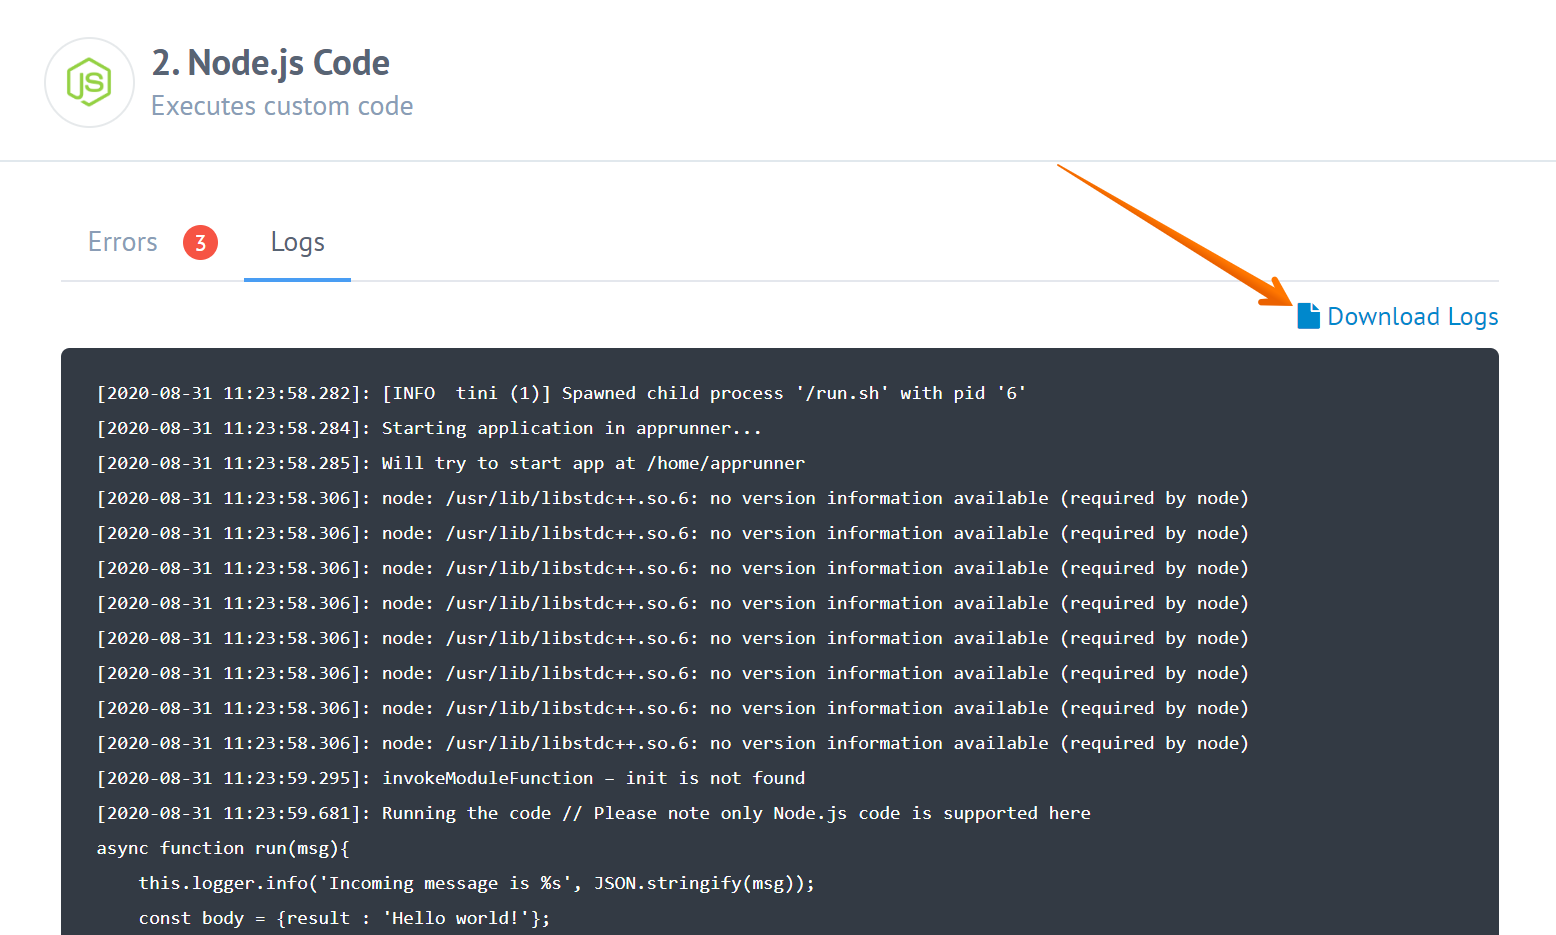
This will get you a copy of the required logs in .log format.