Product Update - v25.43
New Features
Dashboard Enhancement
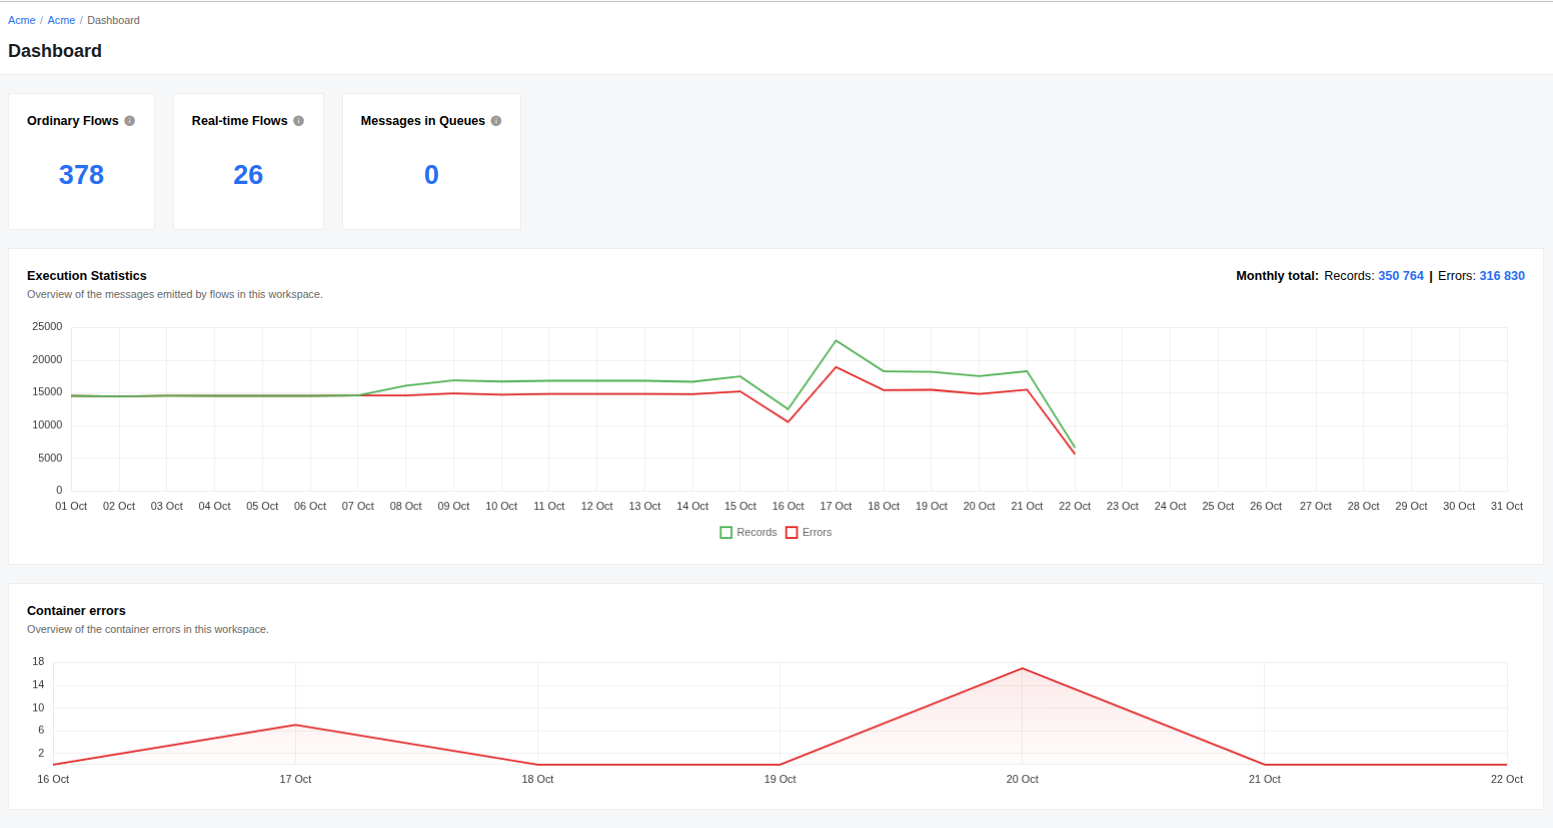
We have enhanced the Execution Statistics graph on the Dashboard to provide more comprehensive data:
- Monthly Data Display: The graph now displays emitted messages and errors for all steps throughout the entire current month.
- New Metrics Added: Monthly totals for both records and errors are now included, offering a clearer overview of performance trends.

Execution Page Update
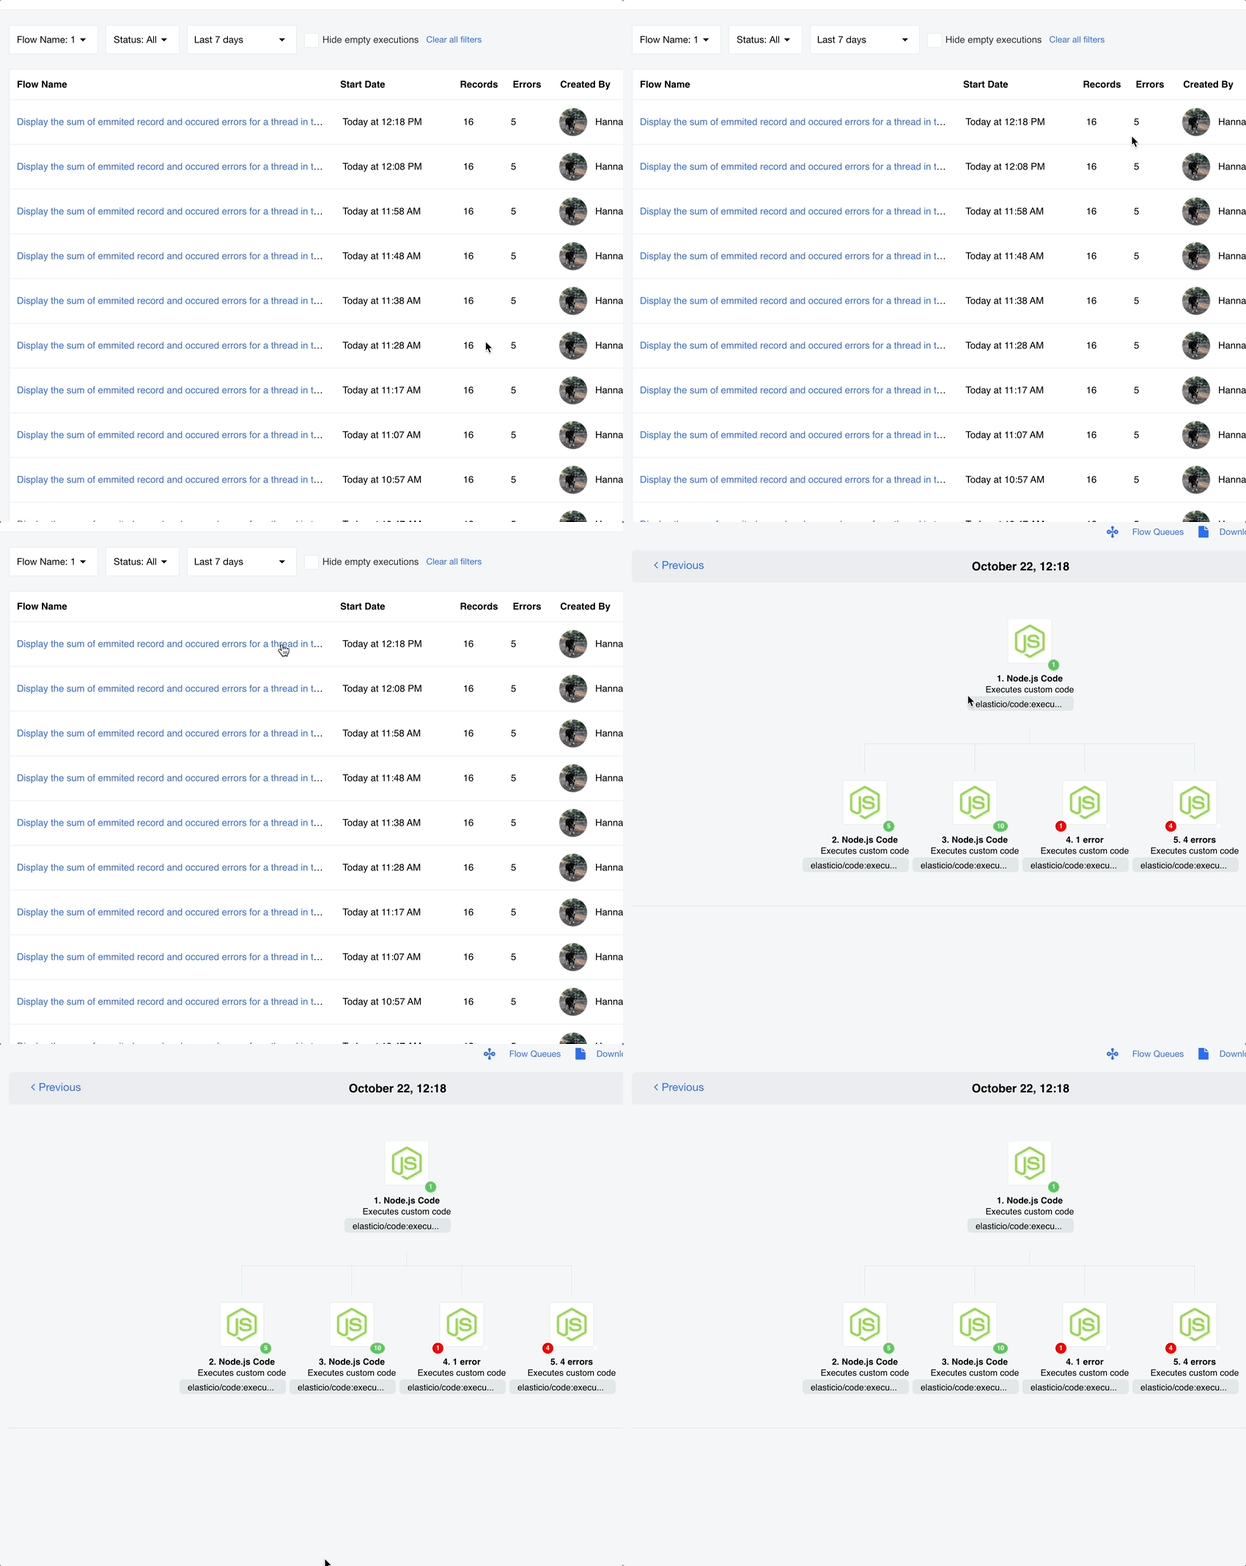
We have improved the display of the Records and Errors pipelines on the Execution page to provide a more accurate representation of your integration flow data.
- The page now displays the total number of emitted records and errors for all steps of your integration flow.
Example: Your flow consists of 4 components, with the execution containing 1 record in the 1st step, 2 records in the 2nd step, 1 error in the 3rd step, and 2 errors in the 4th step. Previously, the Execution page displayed only the largest numbers, showing 2 records and 2 errors. Now, the page will display a total of 3 records and 3 errors, accurately reflecting the total from all steps and the emitted messages and errors.
This change offers a clearer and more comprehensive view of your integration performance.

Logging Level Enhancement
We have introduced a new feature to enhance debugging capabilities for scheduled execution and retrieve sample. You can now set the log level for scheduled executions via the API, providing more precise control over the information logged during these executions. This release includes backend updates that support this functionality and pave the way for future user experience improvements. These changes will significantly enhance users ability to troubleshoot and analyse scheduled executions. Stay tuned for upcoming updates that will expand this feature’s accessibility.
Fixed Bugs
- FIXED the bug related to the quota display for Crio container runtimes